|
Directions: Click on the link below. Once you do, click on the "GYX" weather station. This is a weather station in Portland, Maine. (see my picture below to help you.) Once you have done that, create a line graph for the Altitude (HGHT, m) and Pressure (PRES, hPa). Altitude should be your x-axis and Pressure should be your y-axis. Only do the first 15 points! weather.uwyo.edu/upperair/sounding.html 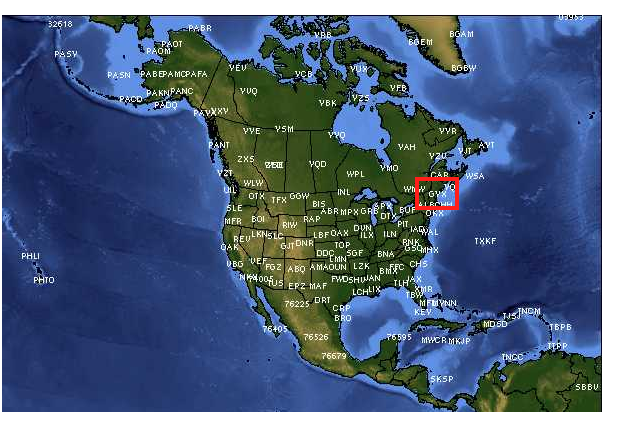
0 Comments
Leave a Reply. |
